

If you haven’t read the past posts in this series, start here before reading today.

Hey investors 👋,
Welcome to today’s Deep Dive.
This is the second part of my free 5-part Deep Dive series on how to analyze stocks, in preparation for the release of my upcoming eBook, How to Analyze Stocks. This eBook is my full framework and process. It will teach you how to find, analyze, research, value, and profit from high-quality stocks. Premium subscribers will receive this eBook for free.
This eBook will teach you how, and my paid analyses will do it for you.
In the last post, we covered how to find high-quality stocks. We briefly learned about what makes a stock high-quality. But now, it’s time to figure out why that business is high-quality in the first place. In other words: it’s time to learn how to examine businesses to figure out if a stock is high-quality (the basics of research).
Let’s get into it. (22 min read)
Today at a glance:
A lasting competitive advantage
& quality management
Stable, consistent financials &
good capital allocation
A lasting competitive advantage
Continuing from the last part in this series, let’s assume you’ve used the method I outlined to find your compounder of choice. How do we start to analyze the business and see if it is, in fact, high quality? Well, let’s start with the simple part: the business itself; how the company makes money.
If you’re reading this, you should know by now that a stock is simply a business with a price tag. Much like buying eggs at the grocery store, picking a stock on the stock market is exchanging your dollars for a share of a business that will, in turn, grow its fundamentals, and in reciprocation as a result, its stock price—therefore making you money. Buying a stock isn’t guaranteed money. You will learn that throughout this series. However, by purchasing part of a reliable, consistently growing business, you can very highly predict the likelihood of positive returns. And as we start this issue, we’re asking a simple question: How does a business publicly listed on the stock market make money?
Easy. Let’s Google that same question. I’ll use Uber to play the example. Feel free to follow along with any stock you’d like.
Google query: How does Uber make money?
Google’s answer:
“Its revenue generation is fuelled by commission-based fees from drivers, alongside dynamic pricing and subscription models.” — Moon Technolabs
For someone familiar with Uber like myself, it’s easy to understand from this result that these commission-based fees are from the rides booked/deliveries ordered from Uber and Uber Eats platforms respectively. The dynamic pricing mentioned, comes from the fact that Uber’s rides change in price based on city and demand, and the subscription models are from Uber One membership. But for someone not familiar with Uber—say when you’re first starting to research the business—then you’ll need to read more.
Either you can press the link embedded that Google showed in this result, which leads you to a website with summarized detail on how Uber makes money, or you can use an LLM to provide you with a simple way to understand the basics of the Uber business. I’ll be using ChatGPT, but whether you use ChatGPT, Gemini, Claude, DeepSeek, or Grok, type the following (insert your respective answers for the company you’re starting to research):
“I typed in Google: How does Uber make money? The embedded answer it gave was: ‘Its revenue generation is fuelled by commission-based fees from drivers, alongside dynamic pricing and subscription models.’ Explain to me in-depth, but with easy, simple wording, what this means and give me a detailed and accurate explanation of how Uber makes money.”
It answered:
“Uber makes money mainly through three key ways: taking a cut from drivers, charging different prices based on demand, and offering subscriptions. Let’s break each of these down in simple terms.
Taking a Cut from Drivers (Commission-Based Fees)
Uber connects riders (people who need a ride) with drivers through its app. When a passenger takes a trip, they pay Uber, and Uber keeps a portion of that money before passing the rest to the driver.
Uber typically takes 15% to 25% of the fare, depending on factors like location and promotions.
The driver keeps the remaining amount after expenses like gas and vehicle maintenance.
Uber also charges extra fees, like booking fees and service fees, which add to its revenue.
Charging Different Prices Based on Demand (Dynamic Pricing)
Uber adjusts its prices based on how many people need a ride versus how many drivers are available. This is called "surge pricing" or "dynamic pricing."
If lots of people are requesting rides (like during rush hour or bad weather), Uber increases the price.
This encourages more drivers to get on the road, helping balance supply and demand.
Uber earns more money per trip when surge pricing is active.
Subscriptions and Additional Services
Uber also makes money from subscription plans and other services beyond rides.
Uber One: A monthly subscription that gives users perks like discounted rides and free delivery on Uber Eats(Uber’s food delivery service).
Uber Eats: Uber charges restaurants a commission (usually 15% to 30%) for food orders placed through the app. They also charge customers delivery fees.
Uber for Business: Companies can use Uber for employee travel and food delivery, and Uber charges fees for managing these services.
Other Revenue Streams
Advertising: Uber shows ads inside its app and charges companies to promote their brands.
Freight (Uber Freight): Uber helps businesses ship goods by connecting truck drivers with companies needing deliveries. It makes money by taking a percentage of the shipping fees.
Car Leasing & Financing: Uber offers rental and leasing options to drivers and makes money through rental fees and interest charges.
Final Summary
Uber makes money by:
Taking a commission from drivers for every ride.
Charging higher prices when demand is high.
Selling subscriptions and charging fees for food delivery and business services.
Earning from ads, freight shipping, and car rentals.
Since Uber doesn’t own cars or employ drivers directly, it makes money by being the middleman between riders, drivers, and other businesses.”
Other than doing mathematical calculations for you (which we will discuss in a future post), this is one of the amazing uses an LLM can make for you during the stock research process. Much more in-depth than the Google result, very accurate, and completely free. Another thing we learn from this is that Uber’s product is its platform. As the LLM answer provided, Uber is simply a middleman business that operates a platform it charges people or businesses to use. So, Uber’s business is both recurring and reoccurring by nature.
Reoccurring: Uber rides and Uber Eats orders are a one-time purchase, but they are a consistent part of people’s daily lives. It’s a more-than-once purchase.
Recurring: Uber’s subscription service, Uber One, is charged to the consumer on a consistent basis, making recurring revenue.
These attributes make up the greatest businesses in the world.
But the greater news? You can easily verify an LLM’s responses by typing in questions related to the answer an LLM gives into Google (Google still serves an amazing use here). For example, in the LLM answer about the business model, to verify the accuracy, you simply go down the list of claims the LLM makes, such as how Uber makes money from Car Leasing & Financing.
To verify this claim, I can Google the following question:
“Does Uber have Car Leasing & Financing?”
Answer: “Uber Xchange is a program that partners with car dealerships to provide drivers with short-term car leases. Drivers are required to pay a deposit upfront then they make scheduled payments while they drive. A huge benefit to the Xchange program is poor credit is not a huge issue.”
I’ve done the same for all the claims in the Uber text from the LLM as shown above, and I found no inaccuracies. (I have found though, that the longer you continue a chat with an LLM, the more and more lies the LLM will provide if it started out that way. Almost seems like a way to shut you up from asking it so many questions.)
Distinguishing a simple & complex business
Over the times I’ve used an LLM for this type of learning (specifically software companies), it generally isn’t inaccurate because the businesses are so simple there’s nothing for the LLM to mix up and accidentally lie about or fabricate. A lot of the more complex businesses, such as Brookfield for example, an LLM cannot fully understand, and it will lie and fabricate.
Brookfield has many complex ownership structures and ways of reporting its business model, so this makes sense.
As an instance, when I went to research my Brookfield history section, ChatGPT was telling me that one of the founders of Brookfield was the former Mayor of a town in Ontario. That was a complete made-up lie, and it turns out this information ChatGPT sourced from was found on Wikipedia. I ended up contacting the current Mayor of this same town to verify ChatGPT’s claim, and he of course, responded by saying it was not accurate.
Here’s his email to me (I found it funny how he recommended me to use ChatGPT/Gemini to verify claims, but just ignore that part):

Without this email, I would have posted a paid analysis of mine with fabricated information. Know the importance of verifying claims and cross-referencing sources.
So in short, for Brookfield, and generally more complex businesses, I would not use an LLM; instead, I would (and do) use the simple Google algorithm after asking how it made money, to scroll and read through articles and the different businesses that Brookfield controls, its structure, etc.
I read posts on Reddit, posts on Blossom, and between all of these sources, I cross-referenced to see if the data added up. It did.
It’s much more time-consuming this way, of course, but it’s also much safer than using an LLM. Something does not save you time on research if the time you’re saving is spent learning lies. It’s worth it to take the extra step to verify the claims, otherwise don’t use an LLM at all.
A rule of thumb: If you’re researching the business of a software company or otherwise, using an LLM to help explain will generate accurate responses. For more physical product companies, infrastructure, etc., stay away. A company with a clear and direct revenue stream is a simple business. A company that takes more than one Google search to find out with clear detail how it makes money is complex.
Here’s a quick way to distinguish a simple business from a complex business so you know the difference:
Simple:
If a company sells one or two products/services (such as a software-as-a-service (SaaS) company or a straightforward consumer product company like Coca-Cola or P&G), it’s a simple business.
Also, on the financial reporting side, businesses with one or two primary sources of revenue are easier to follow and therefore a simpler business.
Complex:
If the company has multiple subsidiaries, operates in more than one industry, or has a variety of revenue streams—like Brookfield—it’s a more complex business.
If a business has multiple, nuanced revenue sources on the financial statements, with its reports spanning multiple tens of pages, it’s a more complicated business. Again, Brookfield is a great example. Even Berkshire, I’d say, is a more “complicated” business. An LLM is likely to fabricate things because of that.
In summary, stay away from LLMs when you find out the company you’re researching is more complex than simple. Even if it takes 10x as long, find sources online using the Google strategy, listen to YouTube videos, read internet posts; just as long as you cross-reference and verify, you’ll be thanking me in the end.
Alright, now that we have the business model understood, we need to examine the business further to understand: What are the company’s core products/services and its major revenue percentages? What’s their position in the industry/market? What’s its market position? Does it have a strong economic moat? What are the risks?
Core product, market position, moat, & risks
It starts again with a Google query:
“[Stock/company name] investor relations.”
Click the first link that pops up on the official website of the company you’re researching, and look around for where it says “presentations/financials/reports.” It could be named something else, but the theme should be the same. This will be your complete page of all the company’s historical financial reports. (These are quarterly and annual reports required by law: 10-Q for U.S. companies or MD&A for Canadian stocks (see below):
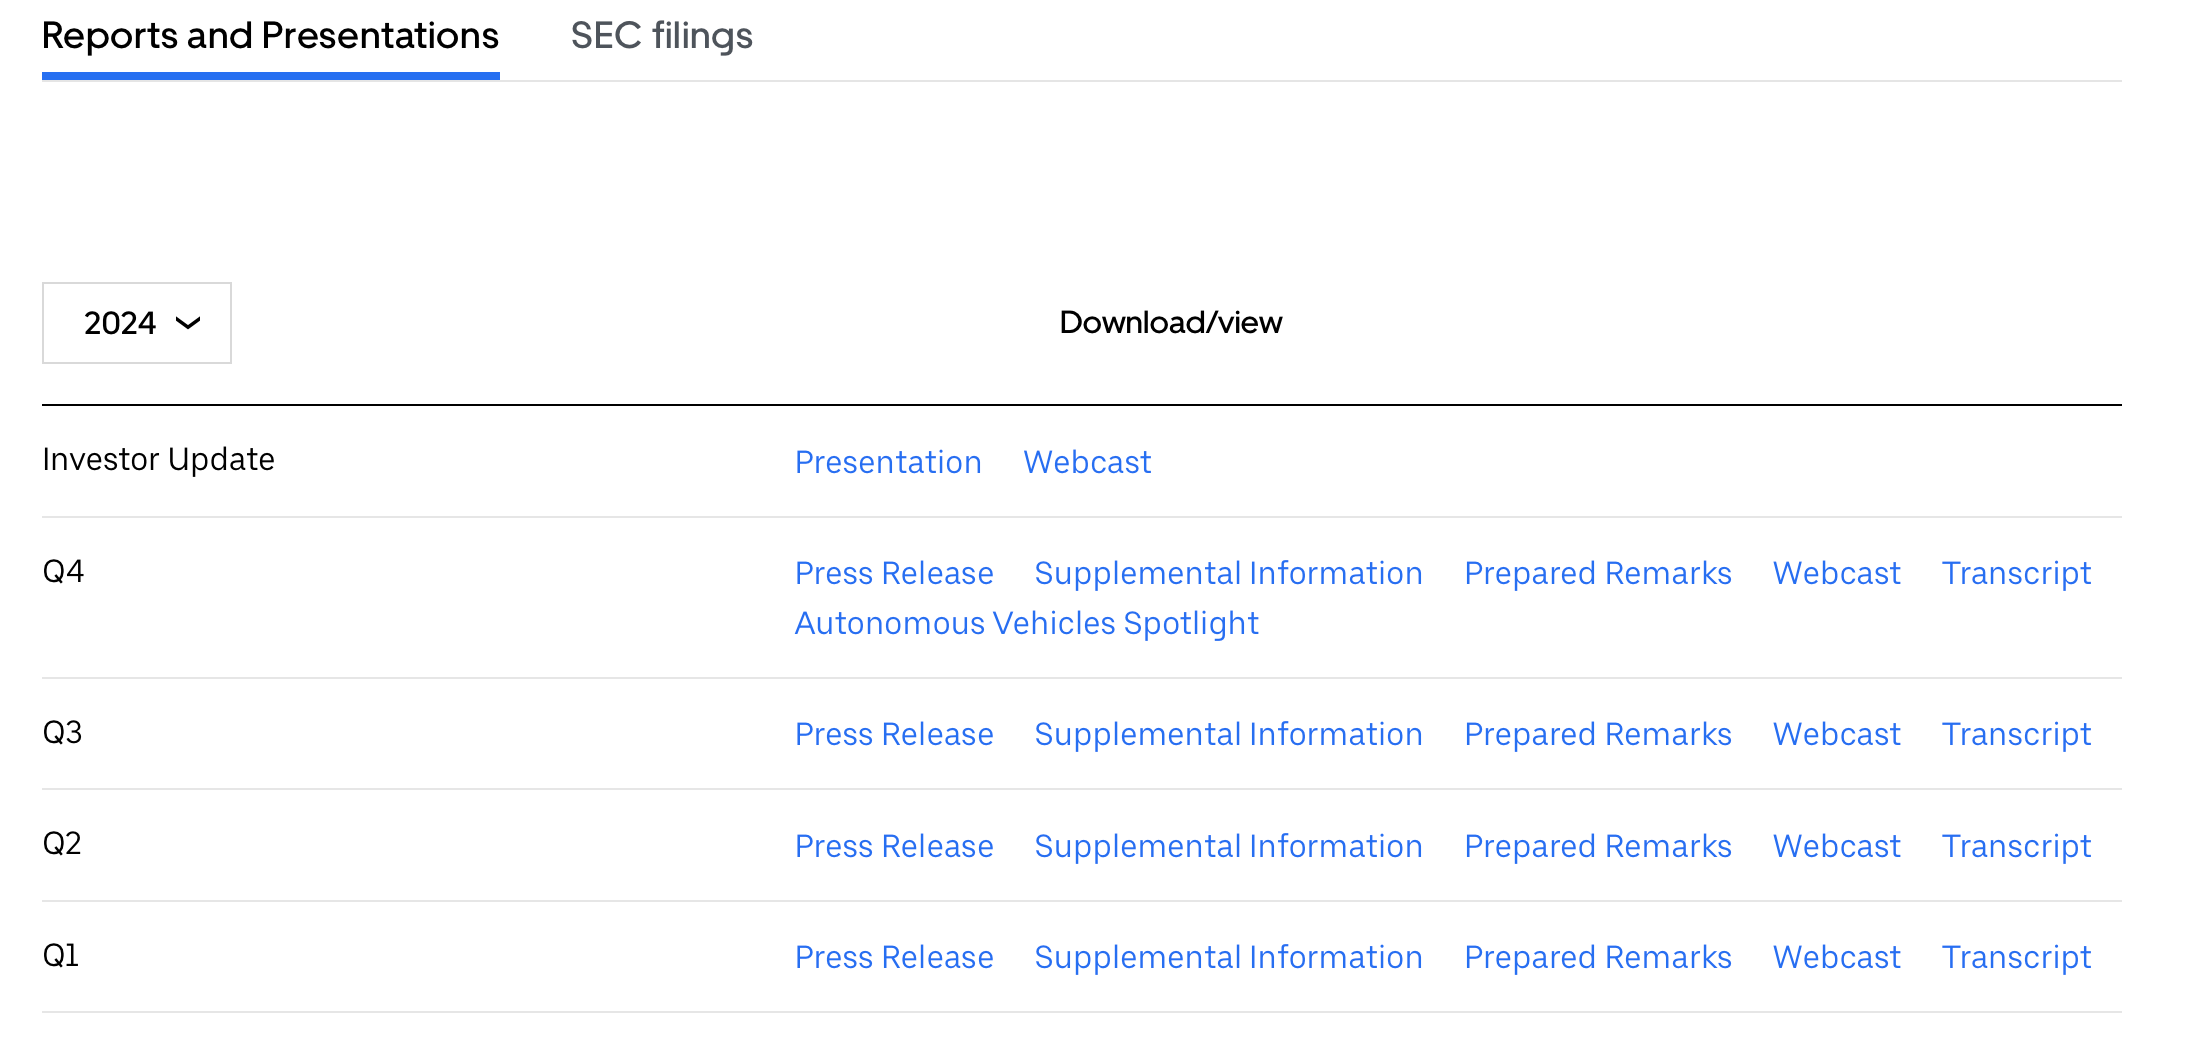
Looking at the most recent quarter and scrolling down to the income statement, we can see the breakdown of products/services by Uber:

The revenue breakdown is as follows (you can use any calculator):
Mobility (Uber): 57.8% of revenue
Delivery (Uber Eats): 31.5% of revenue
Freight (Uber Freight): 10.7% of revenue
It’s now easy to understand that Mobility—in other words, Uber rides—are Uber’s largest contributor to revenue, followed by Uber Eats, and Uber Freight. This is their core product.
We have the basics down. Now, using the Quartr app and access to these reports on the investor’s page, we can read through and listen to the past 8-16 quarters (including annual reports) of the company. The key here is to fully understand management direction, hear how they answer questions, and see if they’ve met guidance among a few issues. (In the Quartr app, you can listen along to the transcript of the call, and the report of that quarter is there as well. You can also make highlights on the transcript to come back later.)
A minimum of 8 quarters (2 years) of quarterly reports and earnings calls is a decent baseline when researching a company. This gives you a full business cycle to understand, enough data to assess revenue growth, profitability, and management consistency, and a look at how the company has responded to various conditions or industry trends during that time frame. (For a deeper understanding, especially for cyclical businesses like John Deere or ASML, looking back 12-16 quarters (3-4 years) or further is best to understand the business cycle.)
You do not need to listen to the full earnings calls when researching here, or read the entire quarterly and annual earnings reports word for word. The key is to focus on the most important sections. For the earnings calls, listen to the opening remarks and key financials, guidance and outlook, and the Q&As from management. This, in total, is probably around 20 minutes. For the reports, read management’s thoughts, summaries, and of course, the financial statements (income statement, cash flow statement, and balance sheet).
In total, for 8 quarters including calls and reports, it should take no less than 8 hours (10 if you have some extra digging, e.g., you decide to dig deeper after something seems off, or maybe read some footnotes, more calls, or outside analyst reports (I find these useless)). This can be done over a few days or weeks—anything that’s comfortable with your schedule. With skimming, you can probably get that down to 3-4 hours. For comprehensive research of up to 16 quarters, double these numbers and that’s how long it could take.
But of course, how long it takes for you will depend on you. These are only my numbers.
This is the most crucial aspect of understanding a business. You can’t ChatGPT or Google your way into finding this information in full.
Listening to management, seeing the written financial results, reading beat or missed guidance/expectations over the past few years (which helps to distinguish if management is honest and transparent about the company’s goals, etc.), and reviewing annual reports, is invaluable. In most cases, just this type of research process is enough for a solid investment decision in a simple business.
Note: Many of the official SEC annual reports are incredibly detailed in both explaining the business of the company, its risks in great detail, the technology involved—everything. So do not skip over the annual reports.
For finding market dominance, you simply search up the industries Uber operates in, followed by market share. This provides the best data. For example, typing “Uber market share ridesharing” and “Uber market share food delivery” into Google. Or, simply divide Uber’s annual bookings by the total market size of the specific industry. The latter would be the most accurate.
You can break this down into geographic regions as well (just simply divide the total geographic market size by the total bookings of Uber by industry in that specific year (or revenue for other businesses)). In all but the APAC region, Uber controls a leading share. North America is its largest market by far. But globally, it has an incredible brand, leading market share, and together that provides a great moat. This is, of course, a very surface-level summary. To get the actual data on brand recognition/awareness, that involves more Google searches.
In fact, for geographic region, this can be found with a quick Google search (“Uber revenue by geographic region”) or in the financial statements (if the company reports it; Uber does not report it, but they do mention growth in regions periodically in earnings calls and via bookings numbers in quarterly reports). As of 2023 (data I could find), Uber made almost $20.43 billion from North America, followed by EMEA with nearly $9.9 billion, APAC with almost $4.43 billion, and LatAm, with almost $2.51 billion in revenue.
Revenue breakdown by geographic region is as follows:
North America: 54.8% of revenue
EMEA (Europe, the Middle East, and Africa): 26.6% of revenue
APAC (Asia-Pacific): 11.9% of revenue
LatAM (Latin America): 6.7% of revenue
For finding risks, as mentioned above, all risks of a company are reported in the SEC annual reports every year. Legally, publicly traded companies must disclose material risks that could impact the company’s financial performance, operations, or stock price. (Also any risks related to accounting assumptions, legal, and debt.) The only risks a company does not need to report are future risks that aren’t reasonably foreseeable, and risks that apply to all companies equally (i.e., a recession). Any risks reported are in the first section in the SEC report under “Item 1A: Risk Factors.” It may be different for some companies.
Here’s Uber’s below (it’s quite detailed):

Uber’s risk factor summary continues for 26 bullet points down the page(s).
Some companies do downplay risks to avoid causing panic with investors, so keep that in mind. But most are generally honest (including those in the S&P 500). However, just because a risk isn’t listed doesn’t mean it doesn’t exist—due diligence is always important. The more complex the business, the more likely that risks are being hidden.
Quick tip to combat this: Look at competitors’ filings to see if they’re reporting a risk that your business isn’t. If so, they were likely hiding or downplaying it.
Search for any major lawsuits, government investigations, or regulatory changes, read the news, listen closely to recent earnings calls/read thoughts on the company in recent reports, and even read around some Reddit posts or posts on Twitter (X) or Blossom. Always double-check and cross-reference sources to verify claims, and always approach risk analysis rationally. Don’t overcompensate for a risk that’s actually minor, and vice versa. Be attentive.
And now that we understand the business, its product, market/industry situation, management direction/accuracy/trust, and its risks, it’s finally time for the quantitative aspect. I’ll be breaking this into two parts: financials and capital allocation. Whew. Okay. You still with me?
Stable, consistent financials
I’m a very visually oriented person when it comes to data. I love seeing graphs, charts, and so forth. Most people I have spoken with about this topic seem to feel the same way. The blandness of the financial statement bores some people. Suprising, right? Over time, I decided to embrace my obsession with graphs and charts, to the point where I pay $16 per month to use a service called Qualtrim. More on this below and how to get the effects of this service for free.
One of the great determinants of a high-quality business is the consistency and stability of its financials and key metrics (for Uber, these key metrics are bookings, trips, and monthly active users (MAU)). Without graphs and visualizations, you can very easily find these attributes by just looking at the financial statements. Also, by looking at growth rates, margins, cash flows, and the balance sheet overtime (to gauge debt levels).
I won’t be showing all of the key metrics for Uber here in the financial reporting just to streamline this post, but know all of the data I mentioned (and presumably all the key metrics of your businesses and more) will be in the financial reports. Almost definitely. I will, however, be sharing images from Qualtrim to show the consistency, and then I will show you a quick way you can have the same effect for free using ChatGPT. (It isn’t needed, though.)
From Qualtrim:


For the example from the financial statements, here are Uber’s revenue numbers over the past four years:


You don’t need a fancy graph to see that growth is in the high teens, and that since 2021, it’s been very consistent in all segments (except freight).
Do the same for the business you’re researching: Get all of the data and metrics reported (revenue, free cash flow, and proprietary metrics such as gross bookings and MAU in Uber’s case) and lay it out over the past 3, 4, or 5 years of reporting if possible, measuring the growth rates and total consistency. Most reports give the growth rates in the financial statements (which you can see above in the screenshots) already.
These are the companies you want. Annually, on the quarterly earnings here (screenshots above), we not only see consistent growth, but also accelerated growth in 2024. Those who follow along know that my desired growth is around 12-15%. Usually, this refers to free cash flow, but it does serve as a great measure for all aspects of the business—including revenue, which reflects FCF indirectly. High revenue growth means high cash flow growth for most high-quality businesses. Which is an amazing attribute to have.
However, if you would like to have those extra graphs—without paying the extra dollars for a stock research program—with just the data, you can get this effect for free, using an LLM. After pasting the revenue data from the screenshot above, I asked ChatGPT to create a visual chart of the revenue numbers with the growth rates year-over-year underneath. It gave me this:
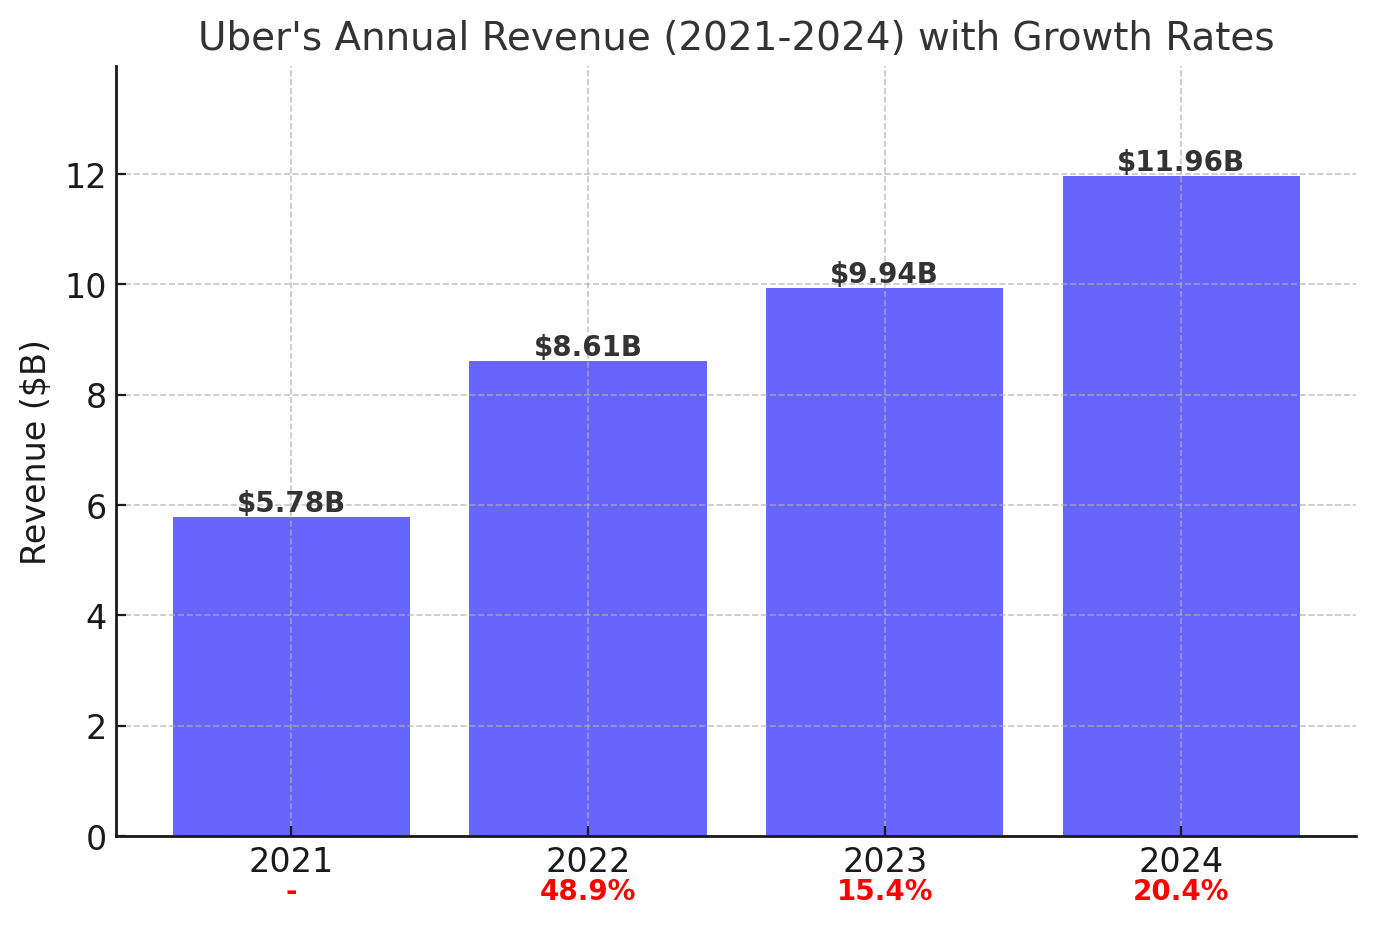
My exact chat was as follows (could be cleaned up): Here are the revenue numbers from Uber over the past 4 years. Chart these numbers, calculate the growth rates, and put the growth rates underneath the numbers on the chart.
Pretty cool! If you ever want some great free visuals with accurate data, this is the best way to do it. It’s a great way to visualize consistency in the businesses you’d like to analyze, especially for those who don’t want to spend money on a stock research platform. Yet, again, it’s not needed if you don’t want it. All this takes is spending time on the research to learn the business, reading spreadsheets, listening to management, making sure the financials are consistent and growing at a decent rate, that debt levels are manageable, and more.
As explained above.
Good capital allocation
We understand how a company makes money perfectly, and now we know the company has consistently strong financials. The final question is: What does it do with that money? A company can be a strong cash generator (a cash cow, if you will), but if management uses the capital of the business incorrectly, it won’t create long-term shareholder value, and your returns will suffer.
To understand, let’s first remember that there are five primary ways companies allocate capital. But with every method, a company could abuse its capital:
Reinvestment in the business
Good spending: Companies can reinvest profits into expansion, R&D, hiring, or improving their product/service. (This is popular for growth-focused, high-capex businesses like Amazon, Google, etc.)
Bad spending: If the company in question has low or even negative returns on invested capital (ROIC), and continues to invest money, they are burning investor value. Be cautious of this.
Acquisitions
Good spending: Some businesses grow through acquiring competitors or other businesses. A lot of acquisitions are done to either improve market share, increase the product offering, control the supply chain, encourage innovation, etc.
Bad spending: If a company is overly reliant on acquisitions for growth, it could be racking up more debt, all while organic growth slows. Organic growth should always be top-of-mind when discussing a high-quality business.
Dividends
Good spending: Return profits to shareholders in the form of dividends. This is more common in stable, mature businesses with low reinvestment.
Bad spending: Paying dividends could signal slowing growth or limited growth opportunities with cash. Alternatively, it could take away from growth by paying out too much. This is much worse if paid with debt.
Share buybacks
Good spending: Companies repurchase their own shares, reducing the share count and increasing earnings per share (EPS).
Bad spending: If the stock is overpriced or if it takes away from growth opportunities.
Debt reduction
Paying down debt can improve financial stability and reduce interest expenses, improving long-term profitability. There are arguably no major cons to doing this. However, buying a company with a decent balance sheet is of utmost importance anyway.
A quality compounder usually prioritizes high-return reinvestment first, with buybacks or dividends as a far secondary priority. If a company has a poor reinvestment strategy and instead focuses on buybacks/dividends at the wrong time, it’s often a red flag, and it’s not a high-quality business.
Let’s take Uber as the example again. Uber has historically focused on reinvestment and acquisitions, one of which was its purchase of Postmates in 2020. However, as the company matures, it has started stock buybacks, while continuing to reinvest significantly into growth. The key question to ask about the business you’re researching: Is the company’s capital allocation aligned with long-term shareholder value creation?
And that marks the end of the second post of this series. I hope you enjoyed; I hope you learned something new. Thanks for reading. Thank you to my paid subscribers and patrons for your support, and thank you to all for being here. Happy finding, investor.
Note: Some people may have different criteria for a quality business, and that’s perfectly fine. Investing is an art, not a science. It just requires some practice to get your style. You first need to know the basics, then continue developing the craft until you’re comfortable enough to consider yourself an artist. The same goes for investing. I’m not a dividend investor, value investor, or growth investor. I’d say I follow GARP (Growth at a Reasonable Price) and do so pretty well (a mix of value and growth), but my style is unique to me, and that’s what I write about. It will also evolve with time.
Thanks for reading. Feel free to reply to this email or comment on the web if you need anything—I always reply. If you enjoyed today’s issue, feel free to share it with friends and family.
All the best,
Jacob
All of my links here.
Serious about high-quality stock investing? My best work is members-only. Don’t miss out on exclusive insights and benefits—upgrade today.
Amazing detailed article. Thank you for this.
Generated a video of it in return :) https://app.symvol.io/videos/examining-quality-compounders-13a3
Solid content; especially appreciate the tips and examples using LLMs.